LEARN BY BUILDING · AGES 14–18

The invisible Universe,
made playable.

Five short experiments about how astronomers read the sky, see radio light and build a telescope as wide as a planet.

GAME 00 · HOW TO READ THE SKY IMAGE

The sky has a ruler.

THE ANGLE LADDER1° = 60′ = 3,600″1 arcsecond = 1,000,000 microarcseconds
READ THE IMAGESKY → IMAGEQUESTION 1 OF 4

FROM DIRECTIONS TO PIXELS

An astronomy image maps directions in the sky onto positions in a picture.

Each pixel covers a known angle on the sky. Across a small part of the image, astronomers use that angle per pixel to measure angular separation.
θ ≈ NUMBER OF PIXELS × ANGLE PER PIXELThe angle covered by one pixel connects distances in a 2D image to directions in the sky. A scale bar shows this information in an easy form.Science reference ↗

GAME 03 · ANGULAR RESOLUTION

How big must our telescope be?

ANGULAR RESOLUTIONθ ≈ λ / Dθ = angular scale, not radius · use radians1″ = 4.848 × 10⁻⁶ rad
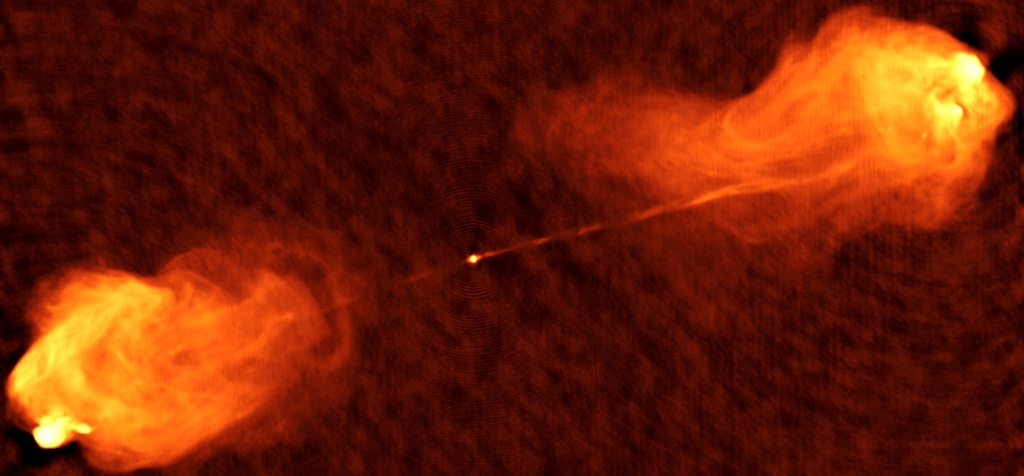
THE TARGET VIEWCygnus AMISSION 01
VLA radio image of Cygnus AHOTSPOTHOTSPOT≈10″≈1′BRIGHT RING ≈ 42 μas ACROSSVLA/NRAO · C. Carilli ↗1 arcmin

POWERFUL RADIO GALAXY

Can your dish separate its two radio lobes?

Cygnus A is about 750 million light-years away. Its two radio lobes are giant magnetised bubbles, together stretching several hundred thousand light-years across.

θ ≈ λ / DCygnus A scale bars are approximate: inferred from the published ≈130″ hotspot-to-hotspot separation, not calibrated from FITS/WCS.Scale source ↗

GAME 01 · MULTIWAVELENGTH ASTRONOMY

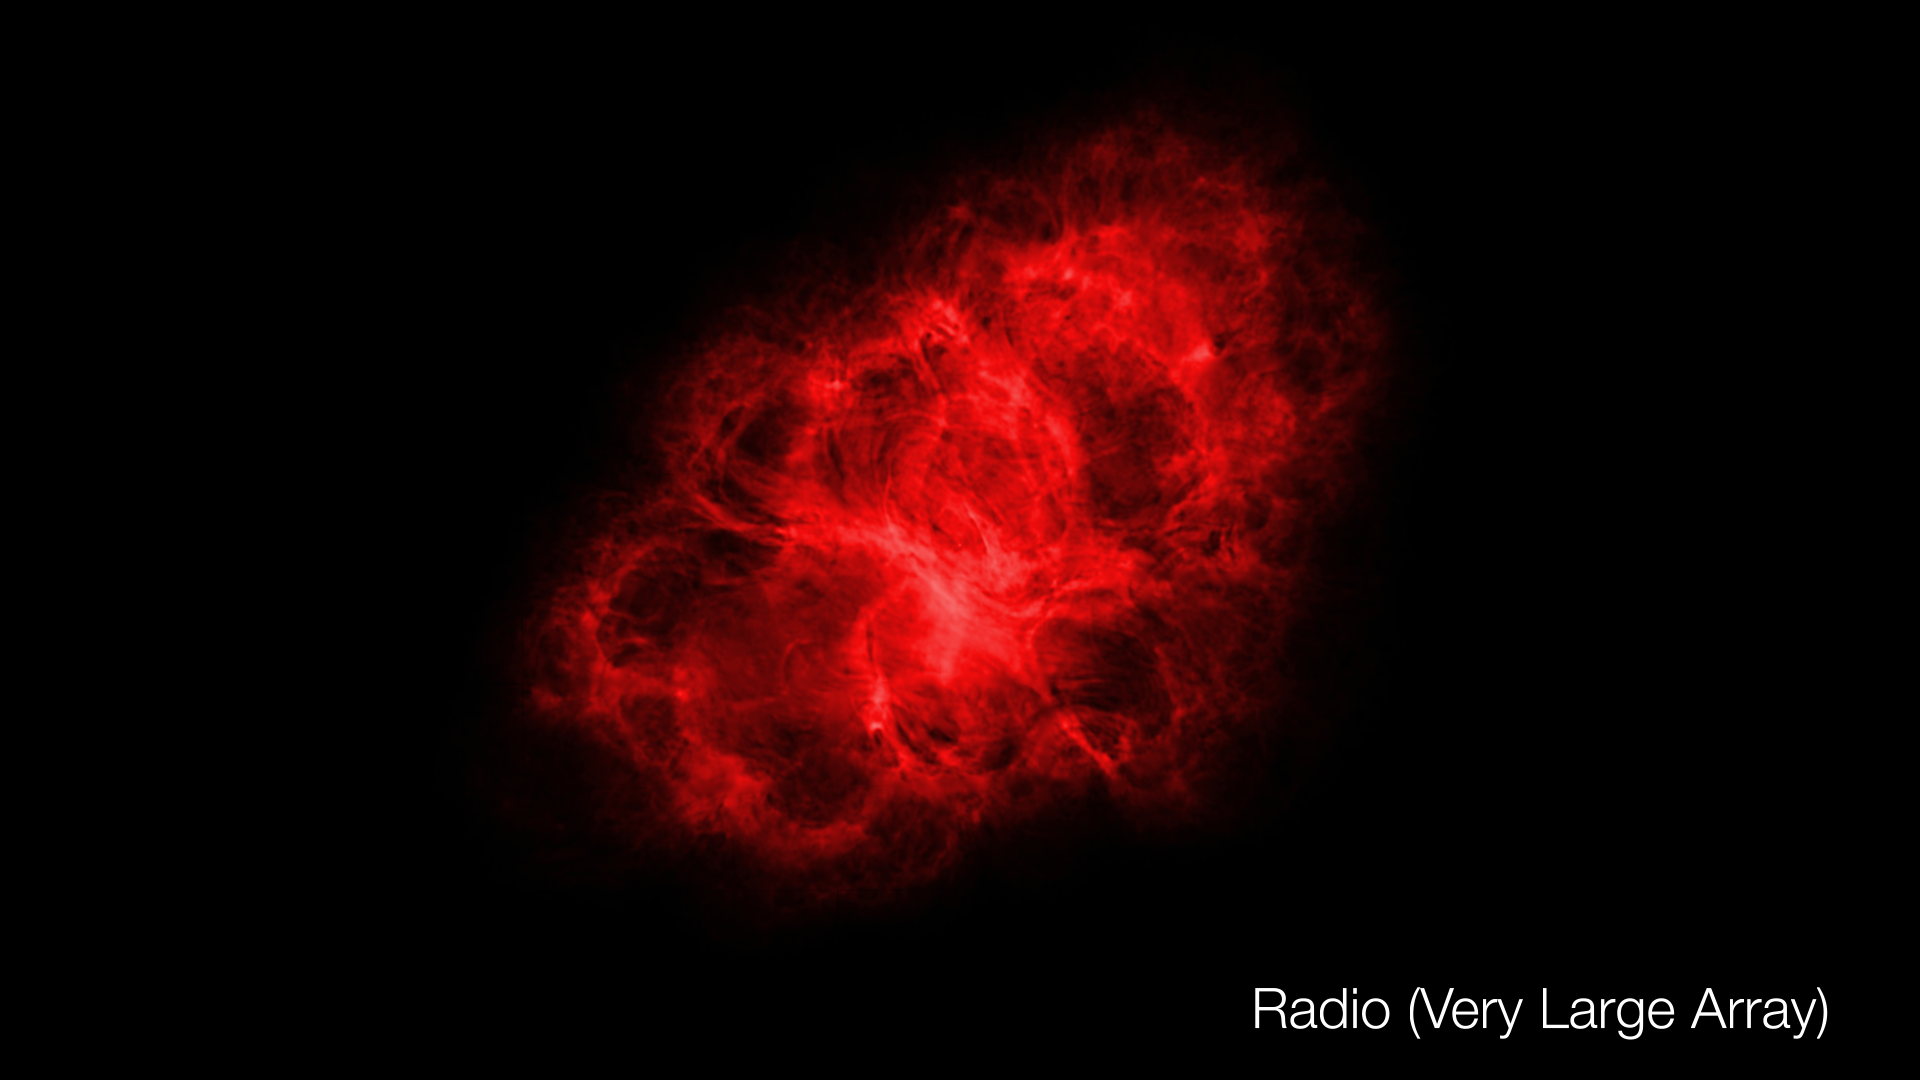
One nebula. Five stories.

Every panel shows the same Crab Nebula, but not the same information. Each wavelength traces different particles, materials and physical processes; astronomers combine them to build a fuller picture.

BANDS SEEN1/5
REAL OBSERVATIONAL DATA · FALSE COLOURRadioLOWER-ENERGY PHOTONS
Radio image of the Crab Nebula
One object does not mean one story.No single band gives the complete picture: radio follows the broad, long-lived particle population; infrared adds dust, lines and synchrotron emission; visible light resolves ejecta filaments; ultraviolet maps higher-energy synchrotron structure; and X-rays reveal freshly accelerated particles near the pulsar.
Quick check:Which band best traces the freshly accelerated, highest-energy electrons closest to the pulsar?

Images: Radio — VLA/NRAO/AUI/NSF · Infrared — NASA/Spitzer/JPL-Caltech · Visible — NASA, ESA & Hubble/STScI · UV — XMM-Newton/ESA · X-ray — NASA/Chandra/CXC. Via NASA SVS 30944.

GAME 02 · FROM GAS TO RADIO LOBES

How do jets build
two giant lobes?

The black hole does not blow out the lobes itself. Gas and magnetic fields outside it help make two jets. The jets carry energy far away and inflate two enormous radio-bright bubbles.

ENERGY PATH0/5
black holeaccretion diskmagnetic-field funneljetradio lobehotspot
Start with gas near a supermassive black hole.Conceptual diagram · sizes and times are not to scale
GAS MOVES INA HOT FLOW FORMSFIELD LINES TWISTJETS CARRY ENERGY OUTLOBES GROW

Science references: NASA: Active Galactic Nuclei · NRAO: Radio Galaxies.

GAME 04 · RADIO INTERFEROMETRY

Where does an array
take measurements?

Each pair of antennas measures one complex visibility at a location in u–v space. Add antennas to make more pairs, then let Earth rotate to sample new locations.

MEASUREMENTS1
01ANTENNA PAIR02PROJECTED BASELINE03ONE u–v MEASUREMENT
YOUR ARRAY2 antennas · 1 pair
Click empty ground to add an antenna
u–v MEASUREMENT SPACE1 measurement
measured visibility conjugate mirror, not another measurement

One antenna pair makes one visibility measurement at this moment.

This is a schematic u–v plane, not a map of positions on the sky. Each location describes a spatial pattern the array can measure. The plotted positions and Earth-rotation steps are illustrative; real coordinates depend on wavelength, source direction and projected antenna separation.
01

Make pairs. N antennas form N(N−1)/2 distinct pairs; each pair can measure a visibility.

02

Choose scales. Short projected baselines sample lower spatial frequencies; long ones sample higher frequencies.

03

Observe over time. As Earth rotates, projected baselines change and the same pairs sample more u–v locations.

Science references: ALMA/NRAO: interferometry basics · NRAO: u–v sampling.

Ready to connect all five ideas?

THE BIG PICTURE · FIVE GAMES

How to read
the sky image.

Each game adds one piece of the same story: a sky angle, a wavelength, a physical source, a resolution limit and an imaging method.

00 · ANGLES

Read the ruler.

A scale bar turns distances in a picture into angles on the sky. Degrees, arcminutes and arcseconds are angle units.

01 · WAVELENGTHS

Ask what each band reveals.

Radio, infrared, visible, ultraviolet and X-ray images trace different particles, materials and processes. No single band tells the whole story.

02 · JETS

Follow the energy.

Gas and magnetic fields outside a black hole help launch opposite jets. The jets make terminal hotspots and inflate radio lobes.

03 · RESOLUTION

Choose a usable angle.

Angular resolution is approximately θ ≈ λ/D, with θ in radians. Shorter wavelength or larger aperture can distinguish finer detail.

04 · SAMPLING

Map the measurements.

Antenna pairs sample the u–v plane at locations set by their projected separations. More pairs and Earth rotation give more measured locations.

ANGLE → WAVELENGTH → SOURCE → RESOLUTION → SAMPLES → IMAGEUse this chain when you encounter a new astronomy image.